#Technical #Analysis of #AUD/#CHF #Pair :
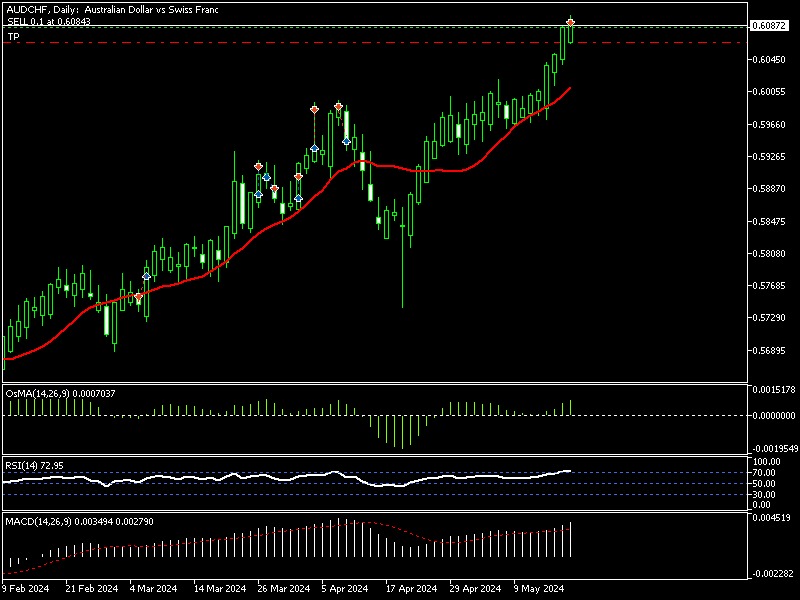
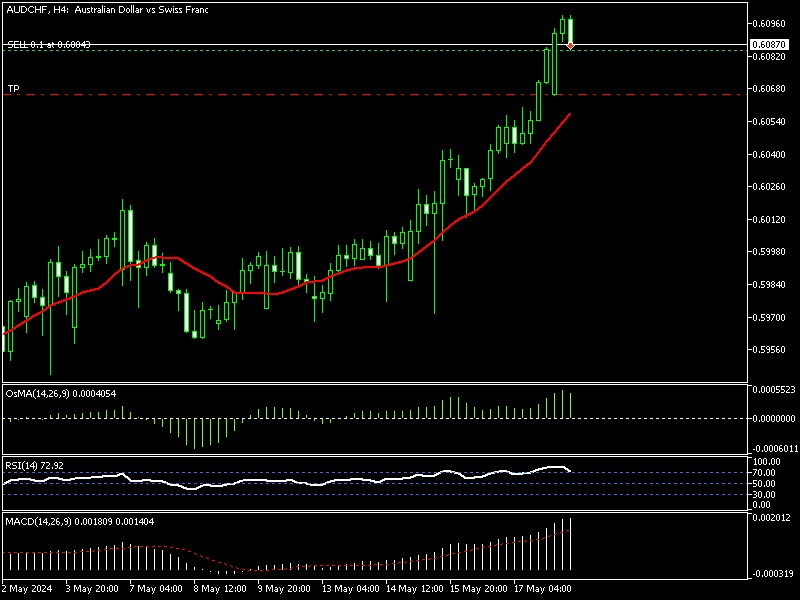
As we can see on the chart, the #AUD/#CHF pair has been rising across various timeframes until it entered the overbought zone on most indicators.
On the 4-hour timeframe, the RSI indicator has crossed the level of 70 while writing this report. Additionally, the MACD indicator shows a significant increase, reaching new levels. On the #Bollinger Bands indicator, we observe that the price has risen and touched the upper band, which confirms the analysis of the Forex Trade Time team that a downturn is the most likely scenario.
On the daily chart, we can see a clear upward movement and the #RSI indicator surpassing the 70 level. This confirms the analysis of the Forex Trade Time team that the upward wave is nearing its end.
On the #Bollinger #Bands indicator for the same timeframe, we find the #price #trading near the upper band, which further confirms the end of the upward wave and the imminent start of a downward movement, providing opportunities to capture #profitable #trades in the near future.
.
#everyday_information #forex #option #Binary_Option #trading #trader #goldstocks #forextrader #fx_trade_time #fxttime #USDollar #euro #JPY #GBP #chfcurrency
#dubai #UAENews #ksasaudiarabia #Syrian #iraq #kuwait #jordan #morocco #Libya #tunisia #algerian #Egypt #qatar #lebanon
#كل_يوم_معلومه #فوركس #خيارات_ثنائيه #تداول_عملات #بورصه #ذهب #فوركس_تريد_تايم #اف_اكس_تريد_تايم #دولار #يورو
#دبي #امارات #السعوديه #سوريا #العراق #الكويت #الاردن #المغرب #ليبيا #تونس #الجزائر #مصر #قطر #لبنان
.
www.fxttime.com/trade

