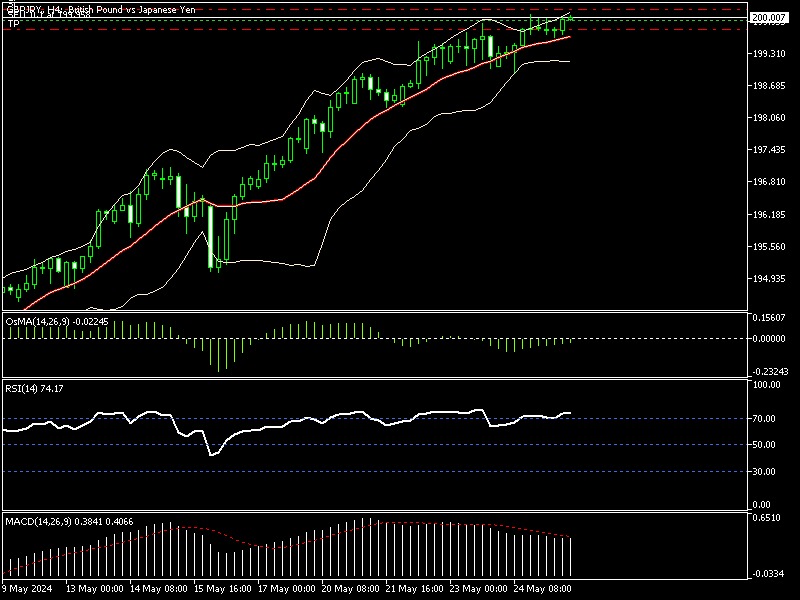
The pair is currently trading around the overbought region after the recent uptrend. The chart shows the formation of potential bearish Japanese candlestick patterns. Some indicators are also suggesting the start of a downward move.
On the 4-hour RSI indicator, the RSI is above the 70 level and approaching 75. This signals that the downward wave may be imminent.
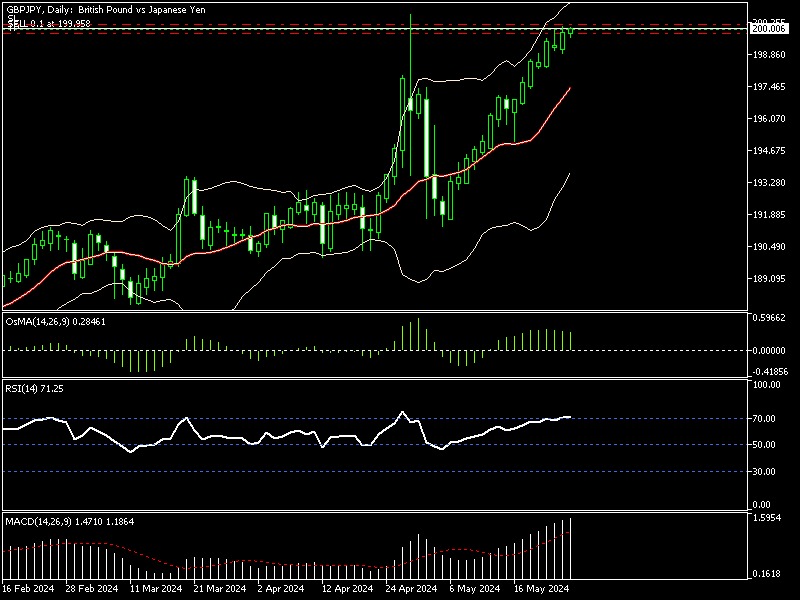
On the daily RSI indicator, the same view is confirmed as the RSI is also above the 70 level.
On the 4-hour and daily Bollinger Bands, the price has approached very close to the upper band, further confirming the same expectation.
.
#everyday_information #forex #option #Binary_Option #trading #trader #goldstocks #forextrader #fx_trade_time #fxttime #USDollar #euro #JPY #GBP #chfcurrency
#dubai #UAENews #ksasaudiarabia #Syrian #iraq #kuwait #jordan #morocco #Libya #tunisia #algerian #Egypt #qatar #lebanon
#كل_يوم_معلومه #فوركس #خيارات_ثنائيه #تداول_عملات #بورصه #ذهب #فوركس_تريد_تايم #اف_اكس_تريد_تايم #دولار #يورو
#دبي #امارات #السعوديه #سوريا #العراق #الكويت #الاردن #المغرب #ليبيا #تونس #الجزائر #مصر #قطر #لبنان
.
www.fxttime.com/trade